 | ||
| Viewing a summary of all the applications recovery configurations | ||
|---|---|---|
| Prev | Administering application recovery | Next |
| ||
| Viewing a summary of all the applications recovery configurations | ||
|---|---|---|
| Prev | Administering application recovery | Next |
To view a summary of all the application recovery configurations, sign in to the Disaster Recovery Orchestrator Console UI as a guest user or a recovery administrator. The Dashboard view appears by default.
If you have a different view open, click the menu in the navigation pane on the left.
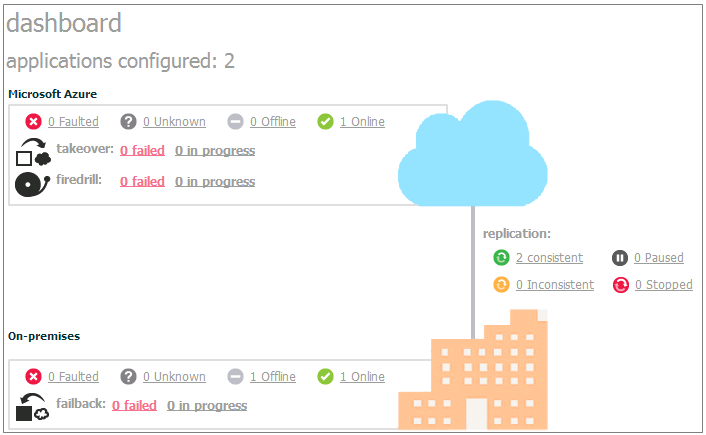
The following figure depicts the Dashboard view.
The Dashboard view provides an overview of all the application recovery configurations on which you have guest or recovery administrator privileges. This view displays the following information:
Total number of on-premises applications configured for recovery in the cloud
Overview of applications at the on-premises site:
Number of applications in the following states: Online, Offline, Faulted, and Unknown
Number of Failback operations that are in progress or have failed
When a Failback operation completes successfully, the application comes online at the on-premises site. Therefore, the number of successful Failback operations are not explicitly displayed.
Number of applications for which the data replication is in the following states: Consistent, Inconsistent, Paused, or Stopped
Overview of applications at the cloud site:
Number of applications in the following states: Online, Offline, Faulted, and Unknown
Number of Firedrill and Takeover operations that are in progress or have failed
When a Firedrill operation completes successfully, the application comes online within the fire drill network at the cloud site. When a Takeover operation completes successfully, the application comes online at the cloud site. Therefore, the number of successful Firedrill operations or Takeover operations are not explicitly displayed.
The following table describes what the various application states mean.
The following table describes what the various replication states mean.