Configuring application monitoring for JBoss Application Server

Perform the following steps to configure monitoring for JBoss Application Server on a virtual machine.

  1. In the Symantec High Availability view of the Veritas Operations Manager Management Server Console, click Configure Application Monitoring.

    This launches the Symantec ApplicationHA Configuration Wizard.

  2. Review the information on the Welcome screen and then click Next.

    The wizard lists all the supported applications for the system.

  3. Select JBoss Application Server and then click Next.

    The JBoss Application Server Specification screen appears.

  4. On the JBoss Application Server Specification page, enter the JBoss Home Directory and the Server Configuration Base Directory. Then click Next.

    The JBoss Application Server Configuration screen appears.

    Note:

    The server configurations which have no bootstrap beans to load into the micrcontainer and no deployments, will not be shown in the list of server configuration on Application Inputs page. For example, minimal.

    To verify the bootstrap beans loaded into the micrcontainer with server deployment, the ApplicationHA framework will check for the presence of the files jboss-beans.xml and bootstrap.xml , located at:

    <ServerBaseDir>/<ServerConfig>/deployers/jbossws.deployer/META-INF/jboss-beans.xml

    <ServerBaseDir>/<ServerConfig>/conf/bootstrap.xml

  5. Select the various JBoss Application Server Configurations that you want to monitor. The various configurations are shown in a list on the left side. You can enable one or more configurations to monitor. For each server configuration, enter the following fields:

    User

    System User under which the JBoss Application Server is executed.

    Administrative User

    Administrative user within JBoss Application Server.

    Administrative Password

    Password of Administrative user within JBoss Application Server.

    Startup Arguments

    Startup arguments to pass the startup script of JBoss Application Server (optional).

    Environment File

    Optional environment file to source before starting JBoss Application Server (optional).

    Binding Set

    The name of the set of bindings to use for the JBoss Application Server Configuration. Every server configuration has unique binding set like default-port, port-01 or port-02, and so on

    JNDI Url

    Modify the default value of the IP address and the port in the link which appears by default in the JNDI Url field according to your JBoss Application Server settings.

    jnp://<ipaddress>:<port>

  6. Click Next

    The wizard will proceed to configure the resources and display their status.

  7. Select the JBoss Application Server Configuration, specify the settings, and then click Next.

    The wizard performs the application monitoring configuration tasks. The ApplicationHA Configuration screen displays the status of each task.

  8. After all the tasks are complete, click Next.

    Note:

    If the configuration tasks fail, click Diagnostic information to check the details of the failure.

    You then have to run the wizard again to configure the application monitoring.

  9. Click Finish to complete the wizard.

    This completes the application monitoring configuration.

  10. To view the status of the configured application on a virtual machine, on the Veritas Operations Manager Management Server console, right-click the appropriate virtual machine and then click Manage ApplicationHA.

    The Symantec High Availability view appears.

    By default, the Component List tab appears. The tab lists each component of the configured application and the status description of each component.

    For more information on viewing and administering applications through the Veritas Operations Manager, see the Symantec ApplicationHA User's Guide.

  11. To view component dependency for the monitored application, click the Component Dependency tab.

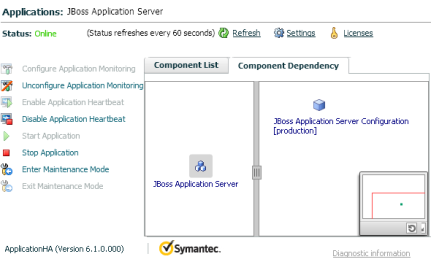
    The component dependency graph appears.

    By default, the component dependency graph shows the configured resources. The left pane displays component groups and/or configured applications. The right pane displays components of the selected component group or application.

    For more information on viewing component dependency for any configured application, see the Symantec ApplicationHA User's Guide.