 | ||
| Understanding the dashboard work area | ||
|---|---|---|
| Prev | Administering application availability using Symantec High Availability dashboard | Next |
| ||
| Understanding the dashboard work area | ||
|---|---|---|
| Prev | Administering application availability using Symantec High Availability dashboard | Next |
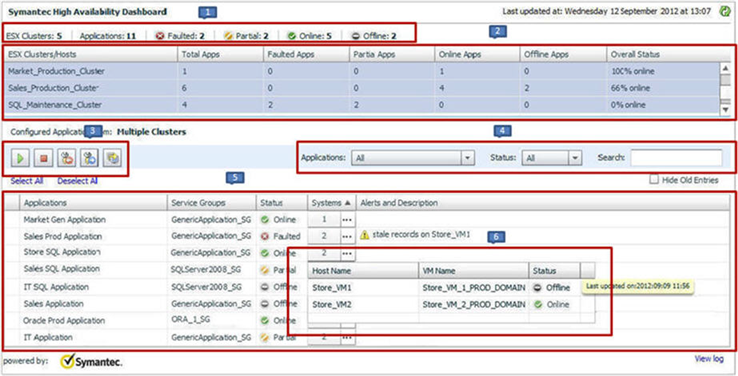
The Symantec High Availability dashboard displays the aggregate application health status information for a datacenter or an ESX cluster.
Depending on whether you click a datacenter or a VMware cluster in the inventory view (left pane) of the VMware vSphere Client GUI, the dashboard displays the aggregate application status information. Apart from the application table described in detail below, the dashboard uses color code and tool tips to indicate the status of an application.
The following figure illustrates the dashboard work area. Note that the red boxes highlight the key GUI elements:
In the above figure, the labels stand for the following elements of the dashboard