 | ||
| Understanding the Veritas High Availability view | ||
|---|---|---|
| Prev | Administering application monitoring from the Veritas High Availability view | Next |
| ||
| Understanding the Veritas High Availability view | ||
|---|---|---|
| Prev | Administering application monitoring from the Veritas High Availability view | Next |
The Veritas High Availability view displays the consolidated health information for applications running in a Cluster Server (VCS) cluster. The cluster may include one or more systems.
The Veritas High Availability tab displays application information for the entire VCS cluster, not just the local system.
The Veritas High Availability view uses icons, color coding, dependency graphs, and tool tips to report the detailed status of an application.
The Veritas High Availability view displays complex applications, in terms of multiple interdependent instances of that application. Such instances represent component groups (also known as service groups) of that application. Each service group in turn includes several critical components (resources) of the application.
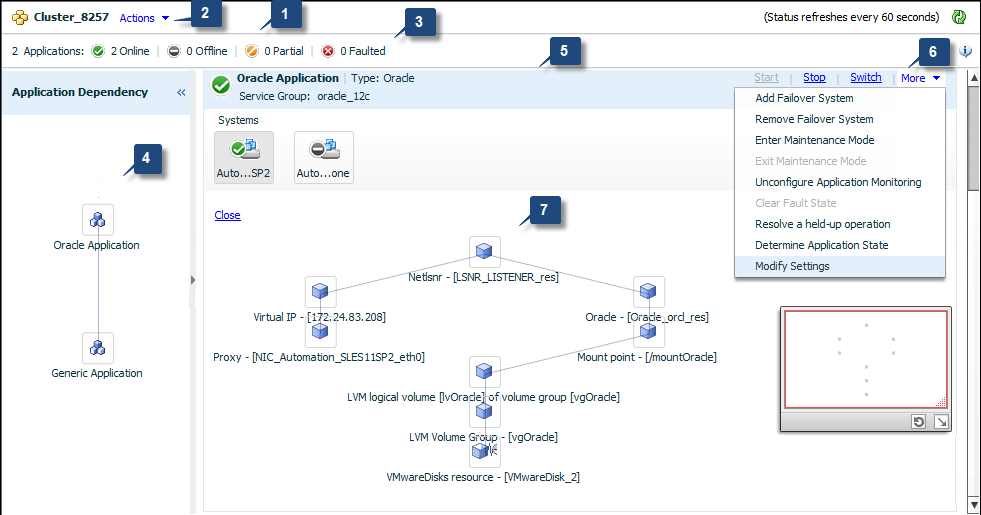
The following figure shows the Veritas High Availability view, with one instance of Oracle Database and one instance of a generic application configured for high availability in a two-node VCS cluster:
|
Title bar |
Actions menu |
|
Aggregate Status Bar |
Application dependency graph |
|
Application table |
Application-specific task menu |
|
Component dependency graph |
The Veritas High Availability view includes the following parts:
Title bar: Displays the name of the VCS cluster, the Actions menu, the Refresh icon, the Alert icon. Note that the Alert icon appears only if the Veritas High Availability view fails to display a system, or displays stale data.
Actions menu: Includes a drop-down list of operations that you can perform with effect across the cluster. These include: Configuring a cluster, Configuring an application for high availability; Unconfigure all applications; and Unconfigure VCS cluster.
Aggregate status bar: Displays a summary of applications running in the cluster. This includes the total number of applications, and a breakdown of the number of applications in Online, Offline, Partial, and Faulted states.
Application dependency graph: Illustrates the order in which the applications or application instances, must start or stop.
If an application must start first for another application to successfully start, the earlier application appears at a lower level in the graph. A line connects the two applications to indicate the dependency. If no such dependency exists, all applications appear in a single horizontal line.
Application table: Displays a list of all applications configured in the VCS cluster that is associated with the local system.
Each application is listed in a separate row. Each row displays the systems where the application is configured for monitoring.
The title bar of each row displays the following entities to identify the application or application instance (service group):
Application-specific task menu: Appears in each application-specific row of the application table. The menu includes application-specific tasks such as Start, Stop, Switch, and a dropdown list of more tasks. The More dropdown list includes tasks such as Add a failover system, and Remove a failover system.
Component dependency graph: Illustrates the order in which application components (resources) must start or stop for the related application or application instance to respectively start or stop. The component dependency graph by default does not appear in the application table. To view the component dependency graph for an application, you must click a system on which the application is running.
The track pad, at the right-bottom corner helps you navigate through component dependency graphs.
If you do not want to view the component dependency graph, in the top left corner of the application row, click .