 | ||
| Example: Identifying the performance issues of an application | ||
|---|---|---|
| Prev | Appendix A. Examples for using Veritas Operations Manager | Next |
| ||
| Example: Identifying the performance issues of an application | ||
|---|---|---|
| Prev | Appendix A. Examples for using Veritas Operations Manager | Next |
As an administrator, one of your responsibilities is to ensure the optimum performance of the applications that are running in your datacenter. Performance issues of your critical applications can have significant negative effect on overall business. For example, if you fail to address long I/O access times for the storage network supporting your e-commerce transaction system, the seasonal surge in transactions could cause significant slowness and have financial implications on the business.
With the Storage Insight Add-on for Veritas Operations Manager, you can get visibility from the application down to the spindle. Veritas Operations Manager empowers you to view the detailed storage information of an array. With this added visibility, you can perform storage management operations with confidence.
Storage Insight Add-on provides you detailed information on the following storage enclosures in your datacenter:
Note: |
You must ensure that you have adequate permissions to access storage views and perform storage management operations on the configurations that the Storage Insight Add-on discovers. |
For information on using the Storage Insight Add-on, refer to the Veritas Operations Manager Storage Insight Add-on for Deep Array Discovery and Mapping 4.0 User's Guide.
In Veritas Operations Manager, you can view performance statistics of the following objects:
Table: Object and performance graphs
The performance graphs have options to:
Specify the duration for which you want to view the performance of one or more objects that you select.
Specify one or more parameters for which you want to view the performance graphs.
Move the mouse pointer over the line chart to view performance data. A tool tip is displayed corresponding to the position of the mouse pointer on the graph.
For information on monitoring performance of objects in Veritas Operations Manager, refer to the Veritas Operations Manager 4.0 Administrator's Guide.
This example explains how you can use the performance graphs on the storage objects in Veritas Operations Manager and the ability to view the application to the spindle mapping, to analyze the following problem:
Problem: The Oracle database that is installed on the LUNs, which are part of IBM XIV enclosure, is slow.
In this example, we use the following names:
Table: Example names
Any of the following can result in the poor performance of ora_db:
The lnx_host that contains ora_db may have many other applications running simultaneously on it. These applications can result in more CPU load on the host or the usage of more memory. If the CPU load or the memory usage exceeds the optimum value, it can affect the performance of ora_db.
Veritas Operations Manager lets you view the performance of lnx_host.
To view the performance graphs for lnx_host associated with ora_db
The available file system size on vxfs_fs that is associated with ora_db may not be enough for the proper functioning of ora_db.
Veritas Operations Manager lets you view the performance of vxfs_fs.
To view the performance graphs for vxfs_fs associated with ora_db
The delay in the I/O time on vxvm_vol that is associated with ora_db can affect the performance of ora_db.
Veritas Operations Manager lets you view the performance of vxvm_vol.
To view the performance graphs for vxvm_vol associated with ora_db
The delay in the I/O time on xiv_disk1 or xiv_disk2 that is associated with ora_db can affect the performance of ora_db.
Veritas Operations Manager lets you view the performance of xiv_disk1 or xiv_disk2.
To view the performance graphs for xiv_disk1 or xiv_disk2 associated with ora_db
Also, Veritas Operations Manager lets you compare the performance of xiv_disk1 or xiv_disk2.
To view the performance graphs for lnx_host associated with ora_db
To view the performance graphs for vxfs_fs associated with ora_db
To view the performance graphs for vxvm_vol associated with ora_db
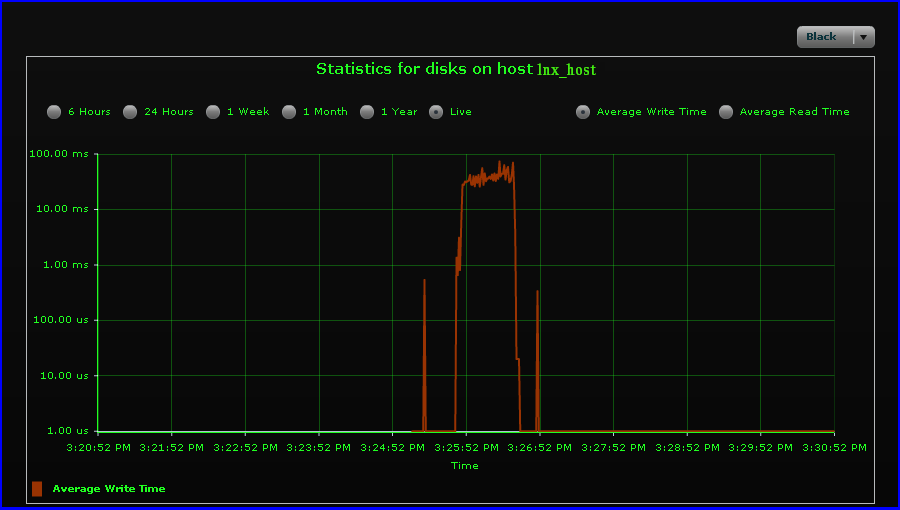
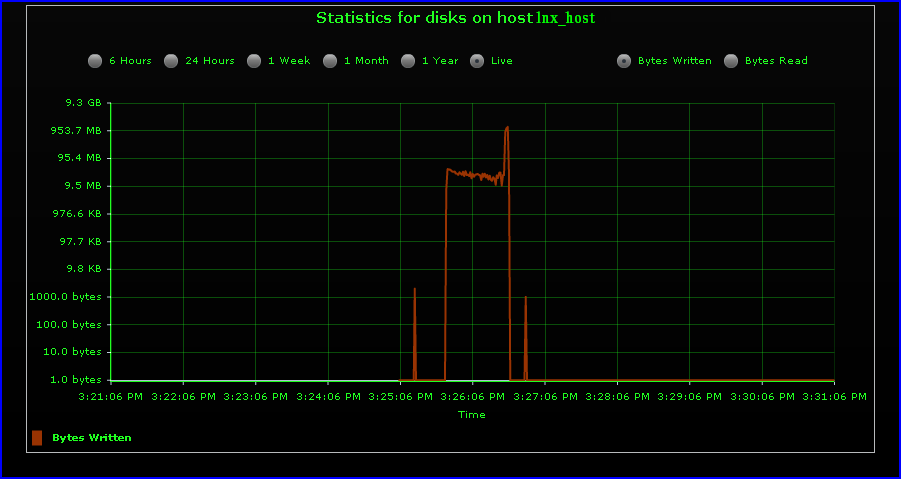
To view the performance graphs for xiv_disk1 or xiv_disk2 associated with ora_db
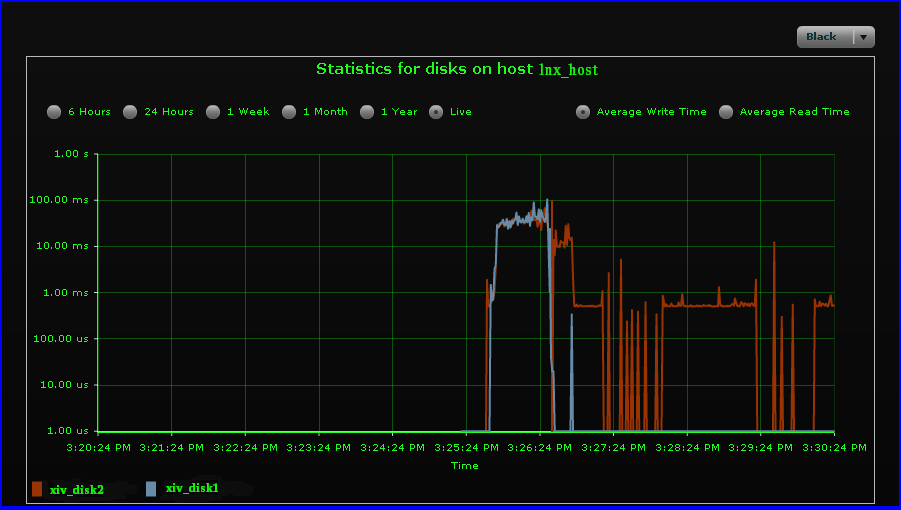
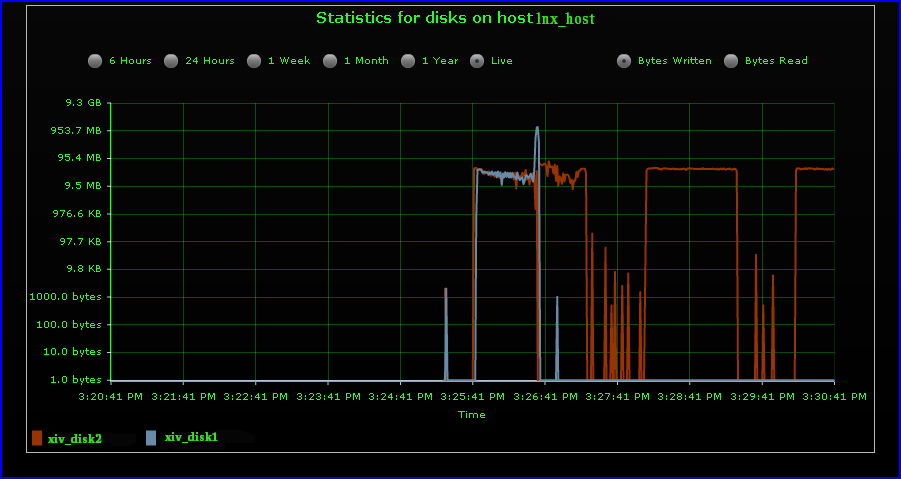
To compare the performance of xiv_disk1 and xiv_disk2
From the performance graphs of xiv_disk1 or xiv_disk2, you notice an issue with the performance of xiv_disk1. The live data in the performance graph of xiv_disk1 displays that the average write time and the average read time is lower than the optimum value. Also, you view from the performance graph that the live data for the Bytes Written and the Bytes Read graphs are lower than the optimum value.
To understand the history of the disk I/O of xiv_disk1, you can use any of the following options that are available on the performance graph:
From the history of the disk I/O of xiv_disk1, you can understand the levels of disk I/O that occurs on xiv_disk1 for a specific period.
From the performance graph of xiv_disk2, you understand that the disk I/O on xiv_disk2 is normal. You can even compare the performance graphs of xiv_disk1 and xiv_disk2 to understand the difference in their performance.
From the performance graphs, you have identified the low disk I/O issue of xiv_disk1. This issue can adversely affect the performance of the ora_db. You must understand the specific problem that results in the low disk I/O on xiv_disk1. To understand the specific problem, you must analyze the details of xiv_disk1. Understanding the cause of the problem can help you make appropriate decisions on addressing the performance issue of the ora_db.
As xiv_disk1 and xiv_disk2 are part of IBM XIV enclosure, you can view the detailed information on them with the help of Storage Insight Add-on.
Note: |
You must configure the deep discovery for IBM XIV storage enclosures to view the details of xiv_disk1 and xiv_disk2. |
For information on managing the Storage Insight Add-on, refer to the Veritas Operations Manager Storage Insight Add-on for Deep Array Discovery and Mapping 4.0 User's Guide.
The following procedure explains how you can view the details of the LUNs that are based on the disks xiv_disk1 and xiv_disk2 in the IBM XIV enclosure. Also, you can view the tiers that are associated with these LUNs.
To view the details of LUNs on which ora_db is installed
In the Veritas Operations Manager console, select Manage > Databases.
In the Databases table, locate the ora_db database and click its name.
In the Disks table, locate the xiv_disk1 or xiv_disk2. In the LUNs column, click the corresponding LUNs.
This example explains how you can view the details of the LUN associated with xiv_disk1.
In the details view of the LUN associated with xiv_disk1, click Disks.
In the Disks table, locate the xiv_disk1 disk. In the Enlosures column, click the name of the enclosure.
In the details view of the enclosure, click the tab Pool Volumes.
In the Pool Volumes view, locate the tier that is assigned to the LUN associated with xiv_disk1. In the Tier column of the Pool Volumes table, understand the tier to which the storage is assigned.
From the Pool Volumes view, you notice that the LUN associated with xiv_disk1 is assigned to a low performance tier. This slow storage tier causes the low I/O of xiv_disk1. The low disk I/O on xiv_disk1 adversely affects the performance of ora_db.
To address this issue, you must provision a new LUN on a high performance tier. Then, you can evacuate the volumes from xiv_disk1 on to the new LUN.
For information on creating tier definitions for LUNs, refer to the Veritas Operations Manager Storage Insight Add-on for Deep Array Discovery and Mapping 4.0 User's Guide.