|
Number of filers (and shares) serviced by each collector
|
If applicable, also specify the number of Windows File Servers with the Windows File Server agents that are configured. |
|
Ping time from Collector to the filers
|
This value should not be more than 1 microsecond. If the value is greater than 1 microsecond, you must investigate network latency issues.
|
|
Server statistics
-
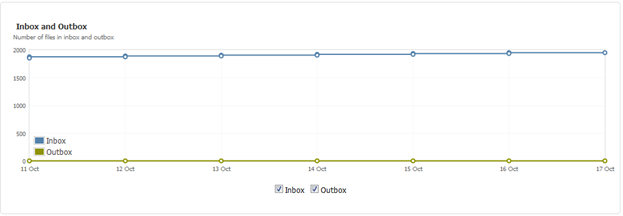
Inbox and Outbox chart
Figure: Inbox and Outbox chart illustrates Inbox and Outbox chart
-
Event pre-processor throughput chart
Pre-processor throughput provides an idea about the processing of collected audit events.
Pre-processor collector threads govern the optimal throughput and CPU utilization.
Figure: Event Pre-processor throughput illustrates the Event pre-processor throughput chart.
|
To collect server statistics, navigate as follows (for each server): > > . Review the following:
-
In the Inbox and Outbox chart, ensure that the Outbox plot follows a smooth saw-tooth pattern.
If the number of files in the Outbox folder consistently rises, investigate if there is a communication issue or network issue.
Check the schedule settings and number of threads to fine-tune the processing of incoming files.
If the Event pre-processor throughput drops, investigate if events
received are few or if pre-processing is not able to catch up. |
|
Basic settings for full and incremental scans under Filesystem scanner settings
|
In the Data Insight UI, navigate to > Collector > , and fine-tune the following parameters as necessary.
Total scanner threads (*): You may increase these, as these threads are not CPU intensive. This value can be higher than the total CPU core count on the server.
Network latency and bandwidth put limits on scanners. Multiple threads use available bandwidth better, during the latency for other thread queries.
However, increasing the thread count does slow down individual scans, due to saturation of network performance.
Begin with a default value of 4 and monitor the network performance.
If there is plenty of bandwidth available, increase thread count until the network utilization increases, but doesn't saturate. Ensure that you allocate bandwidth and CPU resources for audit events and inter-product communication. Start with two threads per core, beyond the default configuration.
If network resources or CPU resource usage averages over 70 per cent, reduce the thread count.
Maximum shares per filer to scan in parallel: Ensure that this value is not more than 4 per filer. Scan settings: Specify if you want to override a scheduled scan or pause a scheduled scan. |
|
Audit Events Pre-Processor Settings
|
In the Data Insight UI, navigate to > Collector > , and change the following settings:
Total collector threads: To improve CPU utilization, increase this value to half the CPU core count. In case of 4 cores, you can keep this value as 3. Default value is 1. Schedule: Schedule pre-processing twice per every indexing job (as per the indexing schedule). For example, if the indexing job runs every 4 hours, pre-processing should run every 2 hours. |
|
Accumulation of backlog and errors in DATADIR/collector
(error and staging)
|
Look for the date of oldest files (backlog): If files are very old, it means pre-processing is not able to keep up with audit events collection. Verify pre-processing settings. You can set this value to more than 2 GB. You can increase the number of threads.
-
Collect the following information:
To see schedule and last run status of the CollectorJob process, execute the command:
configcli list_jobs -
Collect the following log:
installdir\log\collector_n.log.
Where installdir is the installation directory: For example: C:\ProgramFiles\Symantec\DataInsight
Collect the following log: installdir\log\commd.0.0.log
Collect the following contents:
datadir\data\config.db.<n>. Collect the following content:
datadir\data\collector\err\*.sqlite. Collect Event Viewer logs.
|
|
Accumulation of backlog in DATADIR/outbox
|
Look for the date of oldest files (backlog): If the files are very old, investigate if the network is slow or communication is broken
-
Collect the following information
To see the schedule and last run status of CollectorJob and FileTransfer job processes on the collector, execute the following command:
configcli list_jobs Collect Event Viewer logs. If communication issues occur, add the entries of the Iindexer nodes in etc/hosts directory of collectors; and the Collector nodes' entries in etc/hosts folder of Windows File Servers.
|
|
Accumulation of backlog in DATADIR/changelog
|
Look for the date of the oldest file (backlog): If the files are very old, investigate if incremental scans are fail. -
Collect the following information:
Last scan job
Scan schedule
|
|
Check for any errors in DATADIR/scanner (err)
|
|